TL;DR
- Ethereum reflects global liquidity trends, transitioning from accumulation to a potential long-term bull phase.
- The $4,520 resistance level is critical for ETH; a breakout could initiate a rally towards $4,800 or beyond.
- While September may be sluggish, Q4 typically turns bullish, averaging gains from October to December.
Ethereum Moves With Global Liquidity Shift
Ethereum is demonstrating a pattern that correlates with the shifts in global M2 liquidity. Analyst Merlijn The Trader has highlighted a chart showcasing how the price of ETH is rising in tandem with the expansion of broader liquidity.
Notably, the accumulation phase below the $2,750 mark appears to have concluded, as ETH embarks on a new journey characterized as a “Bull Run” on the chart. Merlijn noted,
“Accumulation is done. The bull run is alive,” adding, “This isn’t hopium, it’s macro.”
This chart illustrates both ETH and liquidity trends upward, indicating that Ethereum is responsive to changes in the wider money supply.
ETHEREUM IS TRACKING GLOBAL LIQUIDITY
Accumulation is done.
The bull run is alive.Global liquidity is expanding higher and $ETH is mirroring the move.
This isn’t hopium, it’s macro.Miss it now, and you’ll be chasing above $6K. pic.twitter.com/Ggc2p5GxDS
— Merlijn The Trader (@MerlijnTrader) August 31, 2025
Ethereum is currently trading just below a significant resistance level at $4,520. Analyst Lennaert Snyder has provided a liquidity heatmap indicating a concentration of sell orders in that vicinity.
“ETH liquidity is concentrated around the key $4,520 resistance. Could Ethereum reclaim it today?” he asked.
A successful break above this level may pave the way for additional upward momentum, while failure could lead to short-term pullbacks.
Market Awaits Breakout From Triangle Pattern
On the 4-hour chart, Ethereum has been consolidating within a symmetrical triangle formation for over 10 days. Snyder emphasized that a breakout is expected soon, given the tightening price range.
$ETH is about to choose a direction.
It’s been in compression for 10 days, and a breakout should occur soon.
If Ethereum breaks out upwards, we may target the $4,800 range. A downward break could lead to ~$4,000 as the first support level. pic.twitter.com/PckkgSVoaM
— Lennaert Snyder (@LennaertSnyder) September 1, 2025
A bullish breakout would bring $4,837 into focus as the next target. Conversely, a bearish breakout would first encounter support around $4,071, with additional levels at $3,900 and $3,700 that may attract buyers if prices drop.
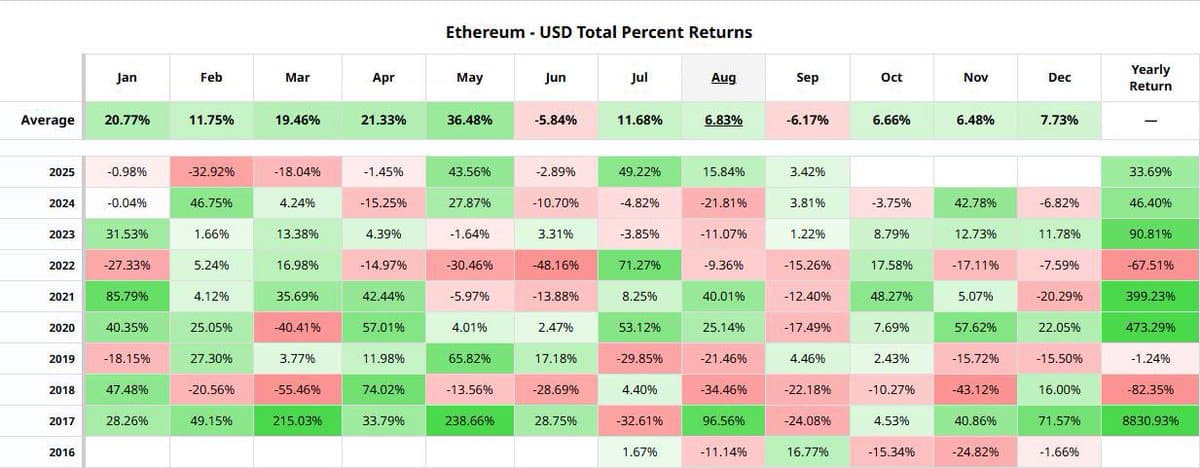
Seasonal History Shows Mixed Outlook
Historical data indicates that September has frequently been a lackluster month for Ethereum. Analyst Cipher X pointed out that the average return for September sits at -6.1%. Some years, such as 2020 and 2022, saw significant declines, while 2021 experienced a noteworthy rally.
Cipher mentioned,
“September might be choppy, but the months that follow have usually been much friendlier to ETH.”
Historically, October, November, and December have yielded improved performance, with average returns exceeding 6% during these months.
Ethereum currently finds itself at a pivotal juncture, with both macroeconomic and technical indicators suggesting significant movement is on the horizon.
The post Is ETH’s Long-Term Bull Run Just Getting Started? This Data Says So originally appeared on CryptoPotato.