Recent on-chain data has revealed a notable decline in the Bitcoin Accumulation Trend Score, suggesting a shift in behavior among investors as they engage in selling rather than accumulating.
Bitcoin Accumulation Trend Score Is Currently Sitting At 0.21
According to a recent post on X by the on-chain analytics firm Glassnode, the current state of the Bitcoin Accumulation Trend Score indicates that investor sentiment is leaning towards distribution. The Accumulation Trend Score is a critical indicator used to assess whether Bitcoin investors are acquiring more assets or opting to sell.
This metric assesses not only the balance changes occurring in investors’ wallets but also weighs these changes against the total size of their holdings. Typically, if the Accumulation Trend Score approaches 1, it signifies robust accumulation by large entities or numerous smaller addresses. Conversely, a score nearing 0 suggests a trend of distribution or a general lack of purchasing activity among investors.
The accompanying chart illustrates the Bitcoin Accumulation Trend Score’s trajectory over the past year:
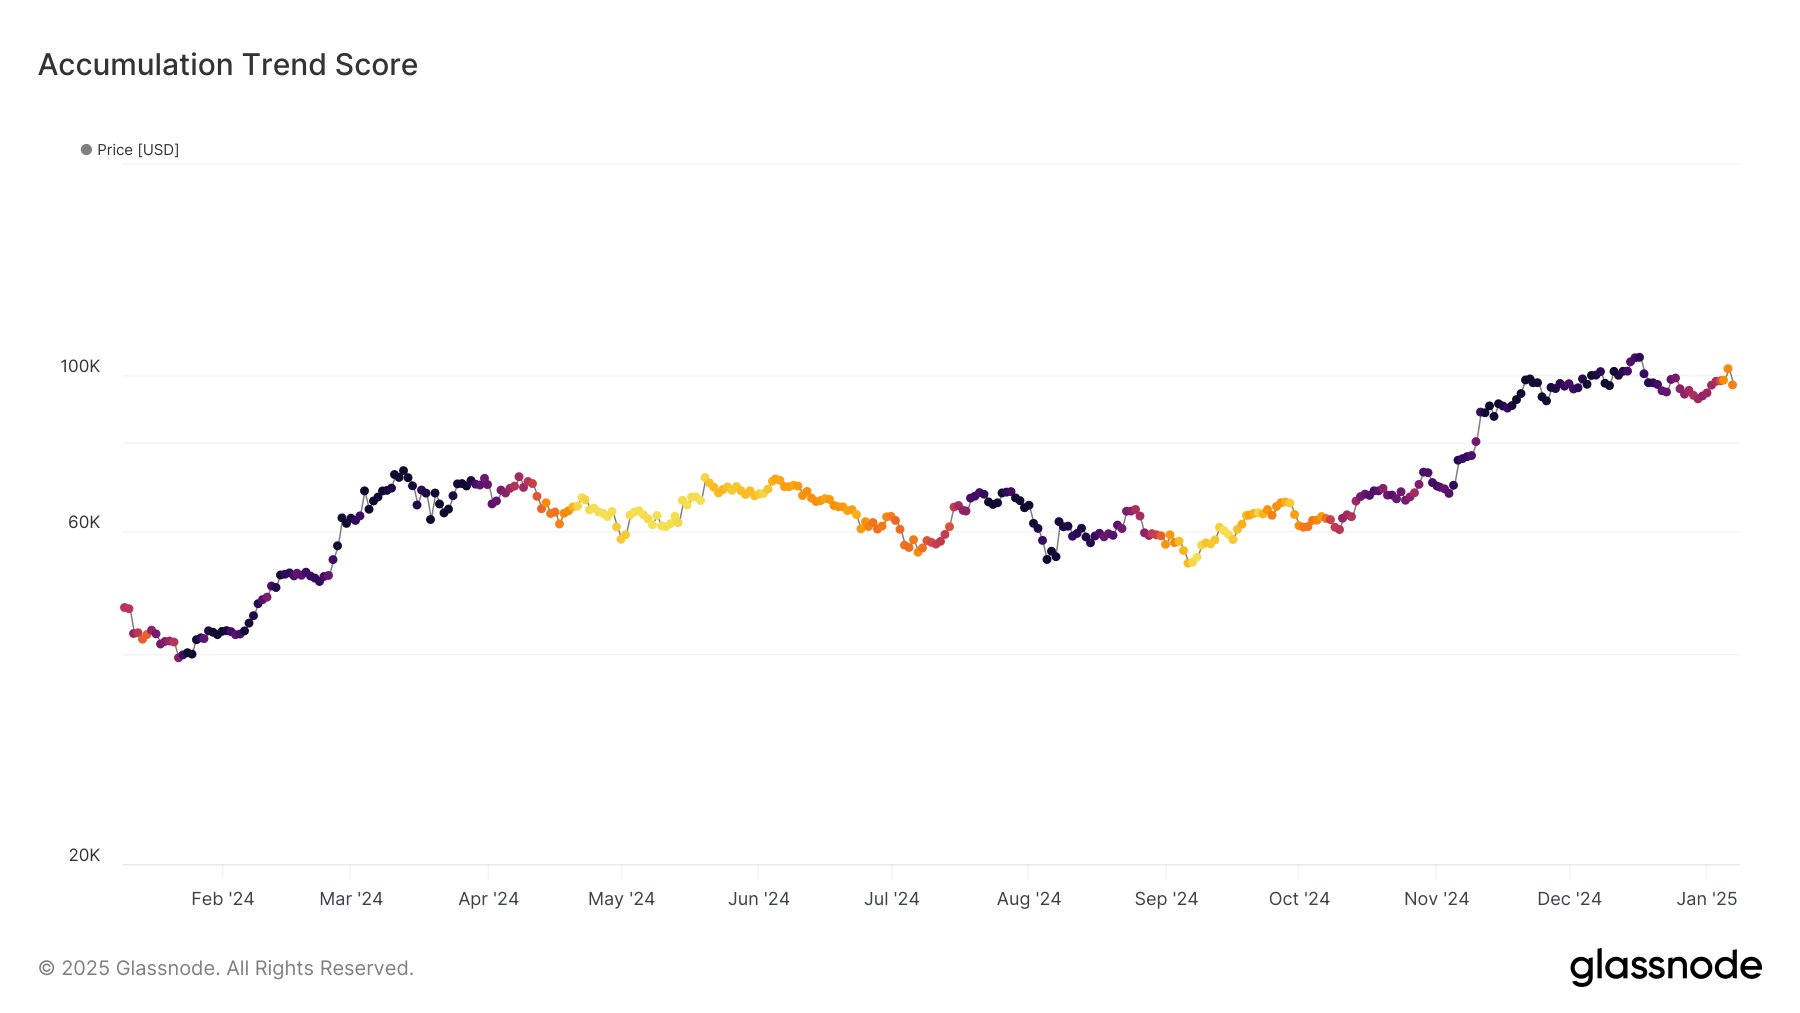
The chart’s dark blue/violet shades represent elevated values of the Bitcoin Accumulation Trend Score, while the orange/red shades indicate values close to zero. Analyzing the chart, it’s evident that the score reached significantly high levels during the latter months of 2024, indicative of substantial buying activity from whales, contributing to Bitcoin’s surge to a new all-time high.
However, toward the end of the year, this accumulation began to dwindle, leading to a current score of just 0.21 as of this year. Additionally, Glassnode has released detailed data for a variant of the Accumulation Trend Score, illustrating accumulation and distribution behaviors across different BTC cohorts.
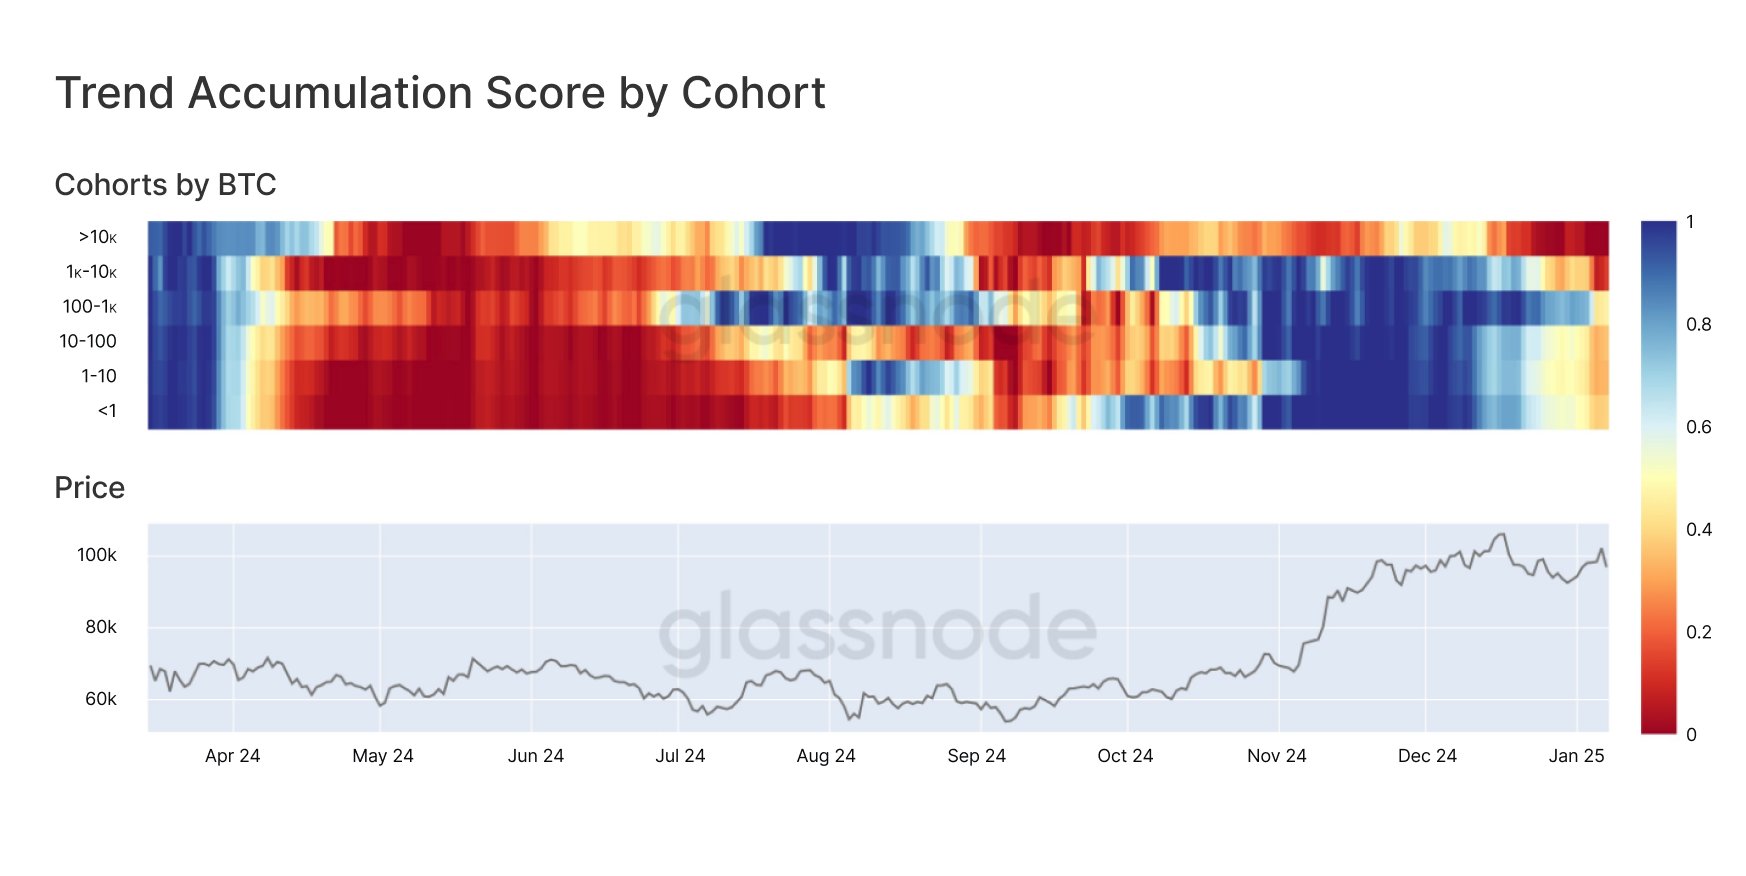
As highlighted in the graph, the so-called “mega whales,” or investors holding over 10,000 BTC, have been engaging in selling since September, with particularly heavy distribution observed in recent weeks. Although other investing cohorts demonstrated buying activity during Bitcoin’s rally, they too have recently shifted towards selling. Notably, holders with between 1,000 and 10,000 BTC have been particularly active in selling.
Without a return to the blue shades on the trend chart, the prospects for Bitcoin remain dominated by this bearish trajectory.
BTC Price
As of this writing, Bitcoin is trading around $93,900, reflecting a decline of over 3% within the last week.