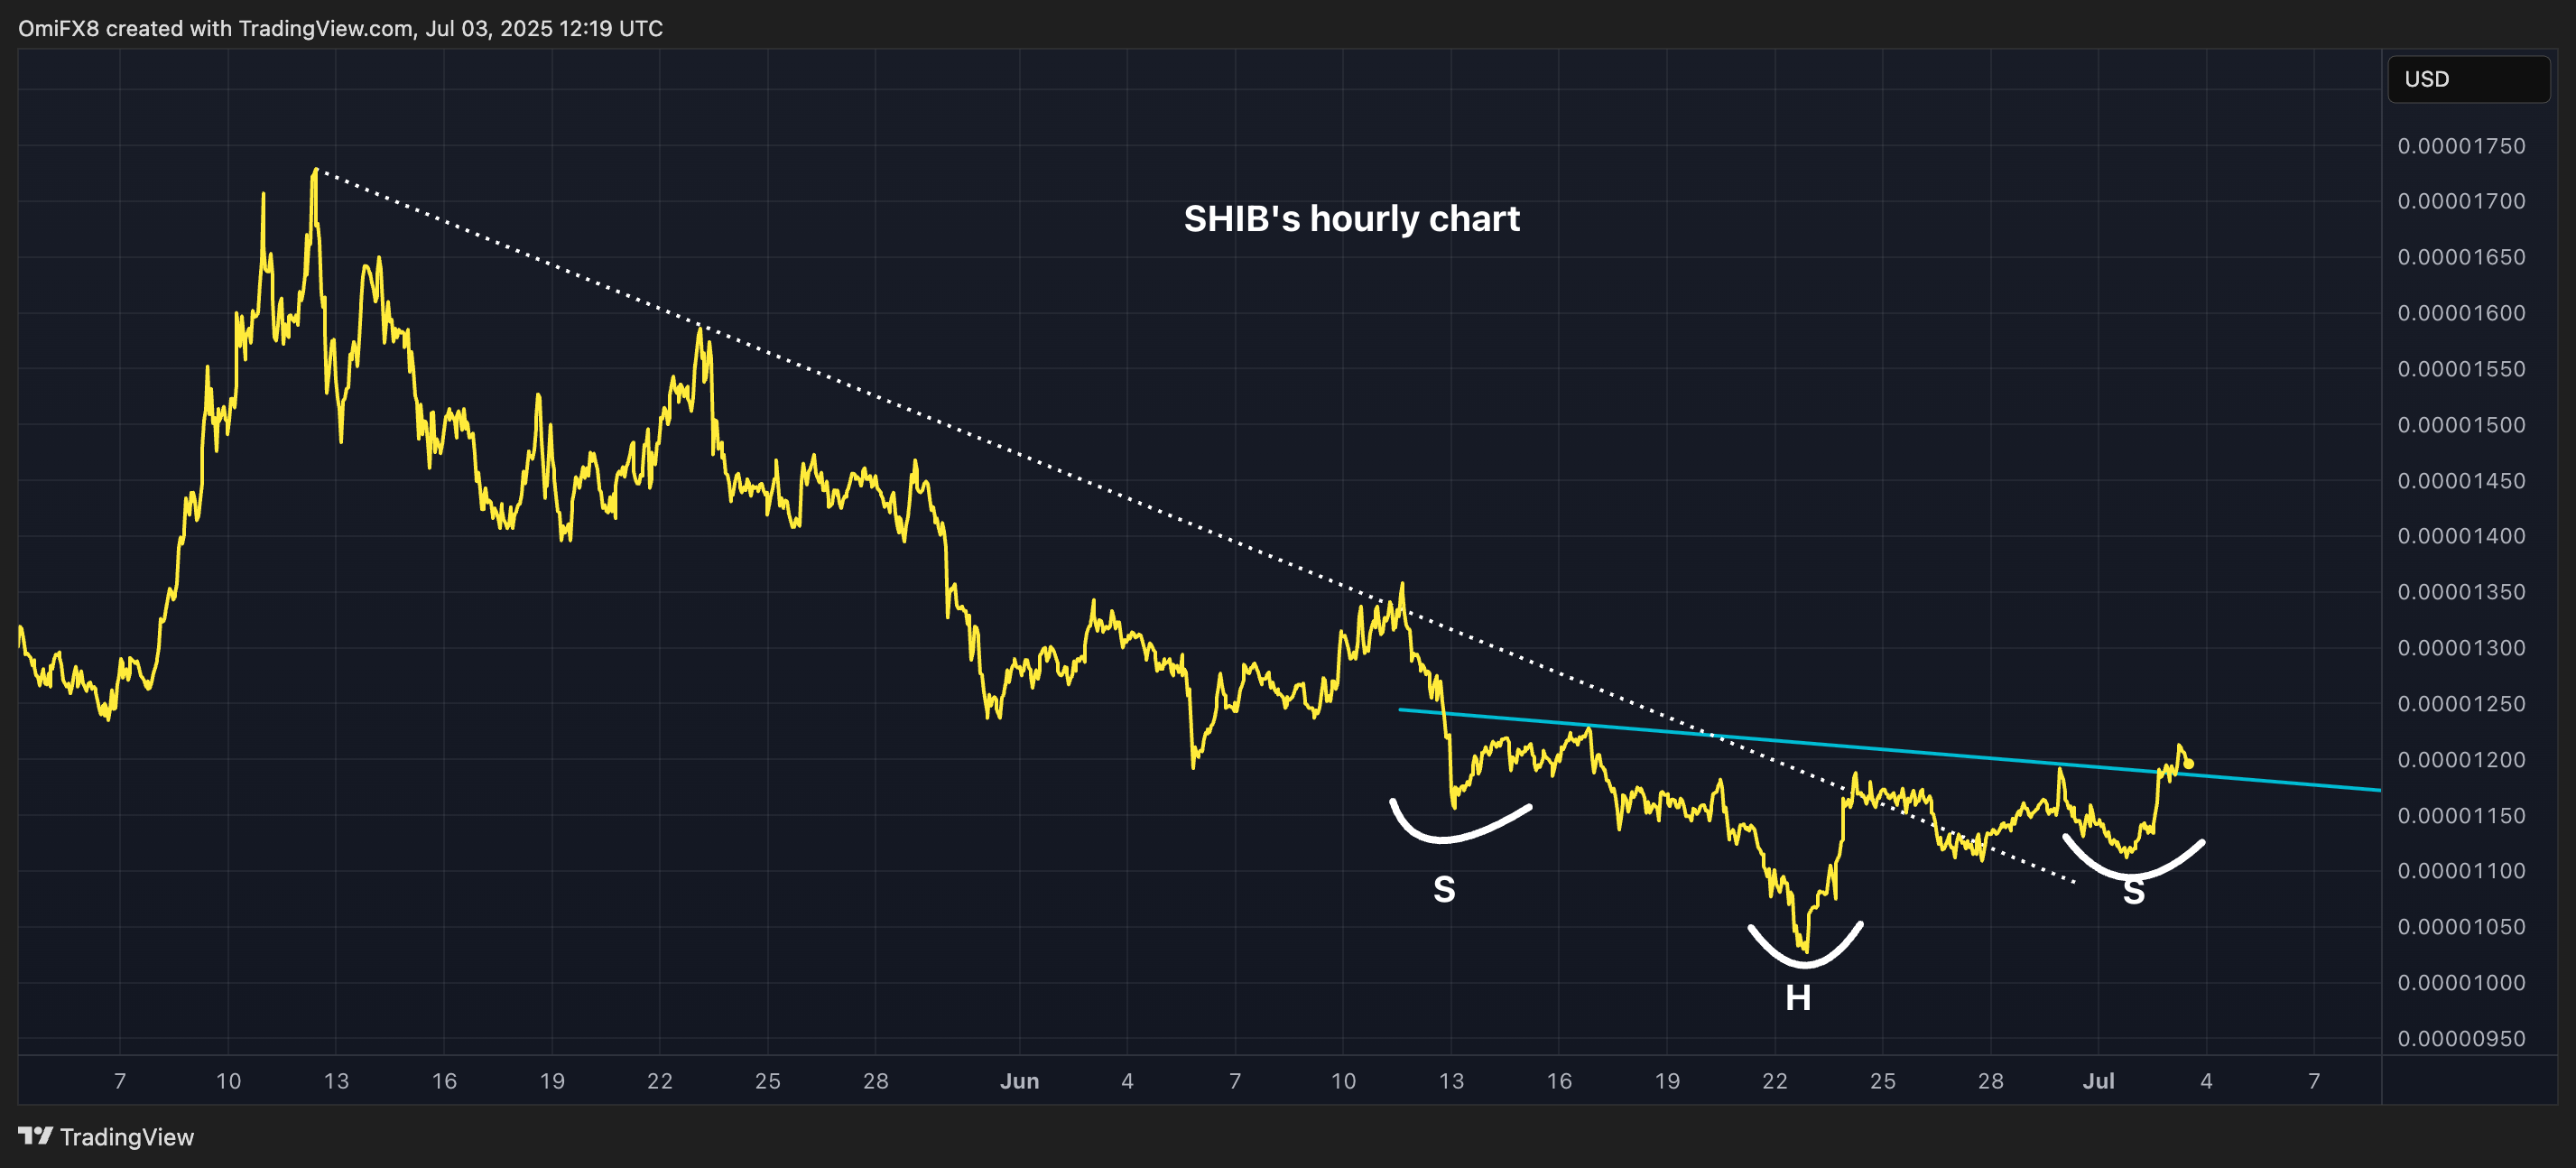
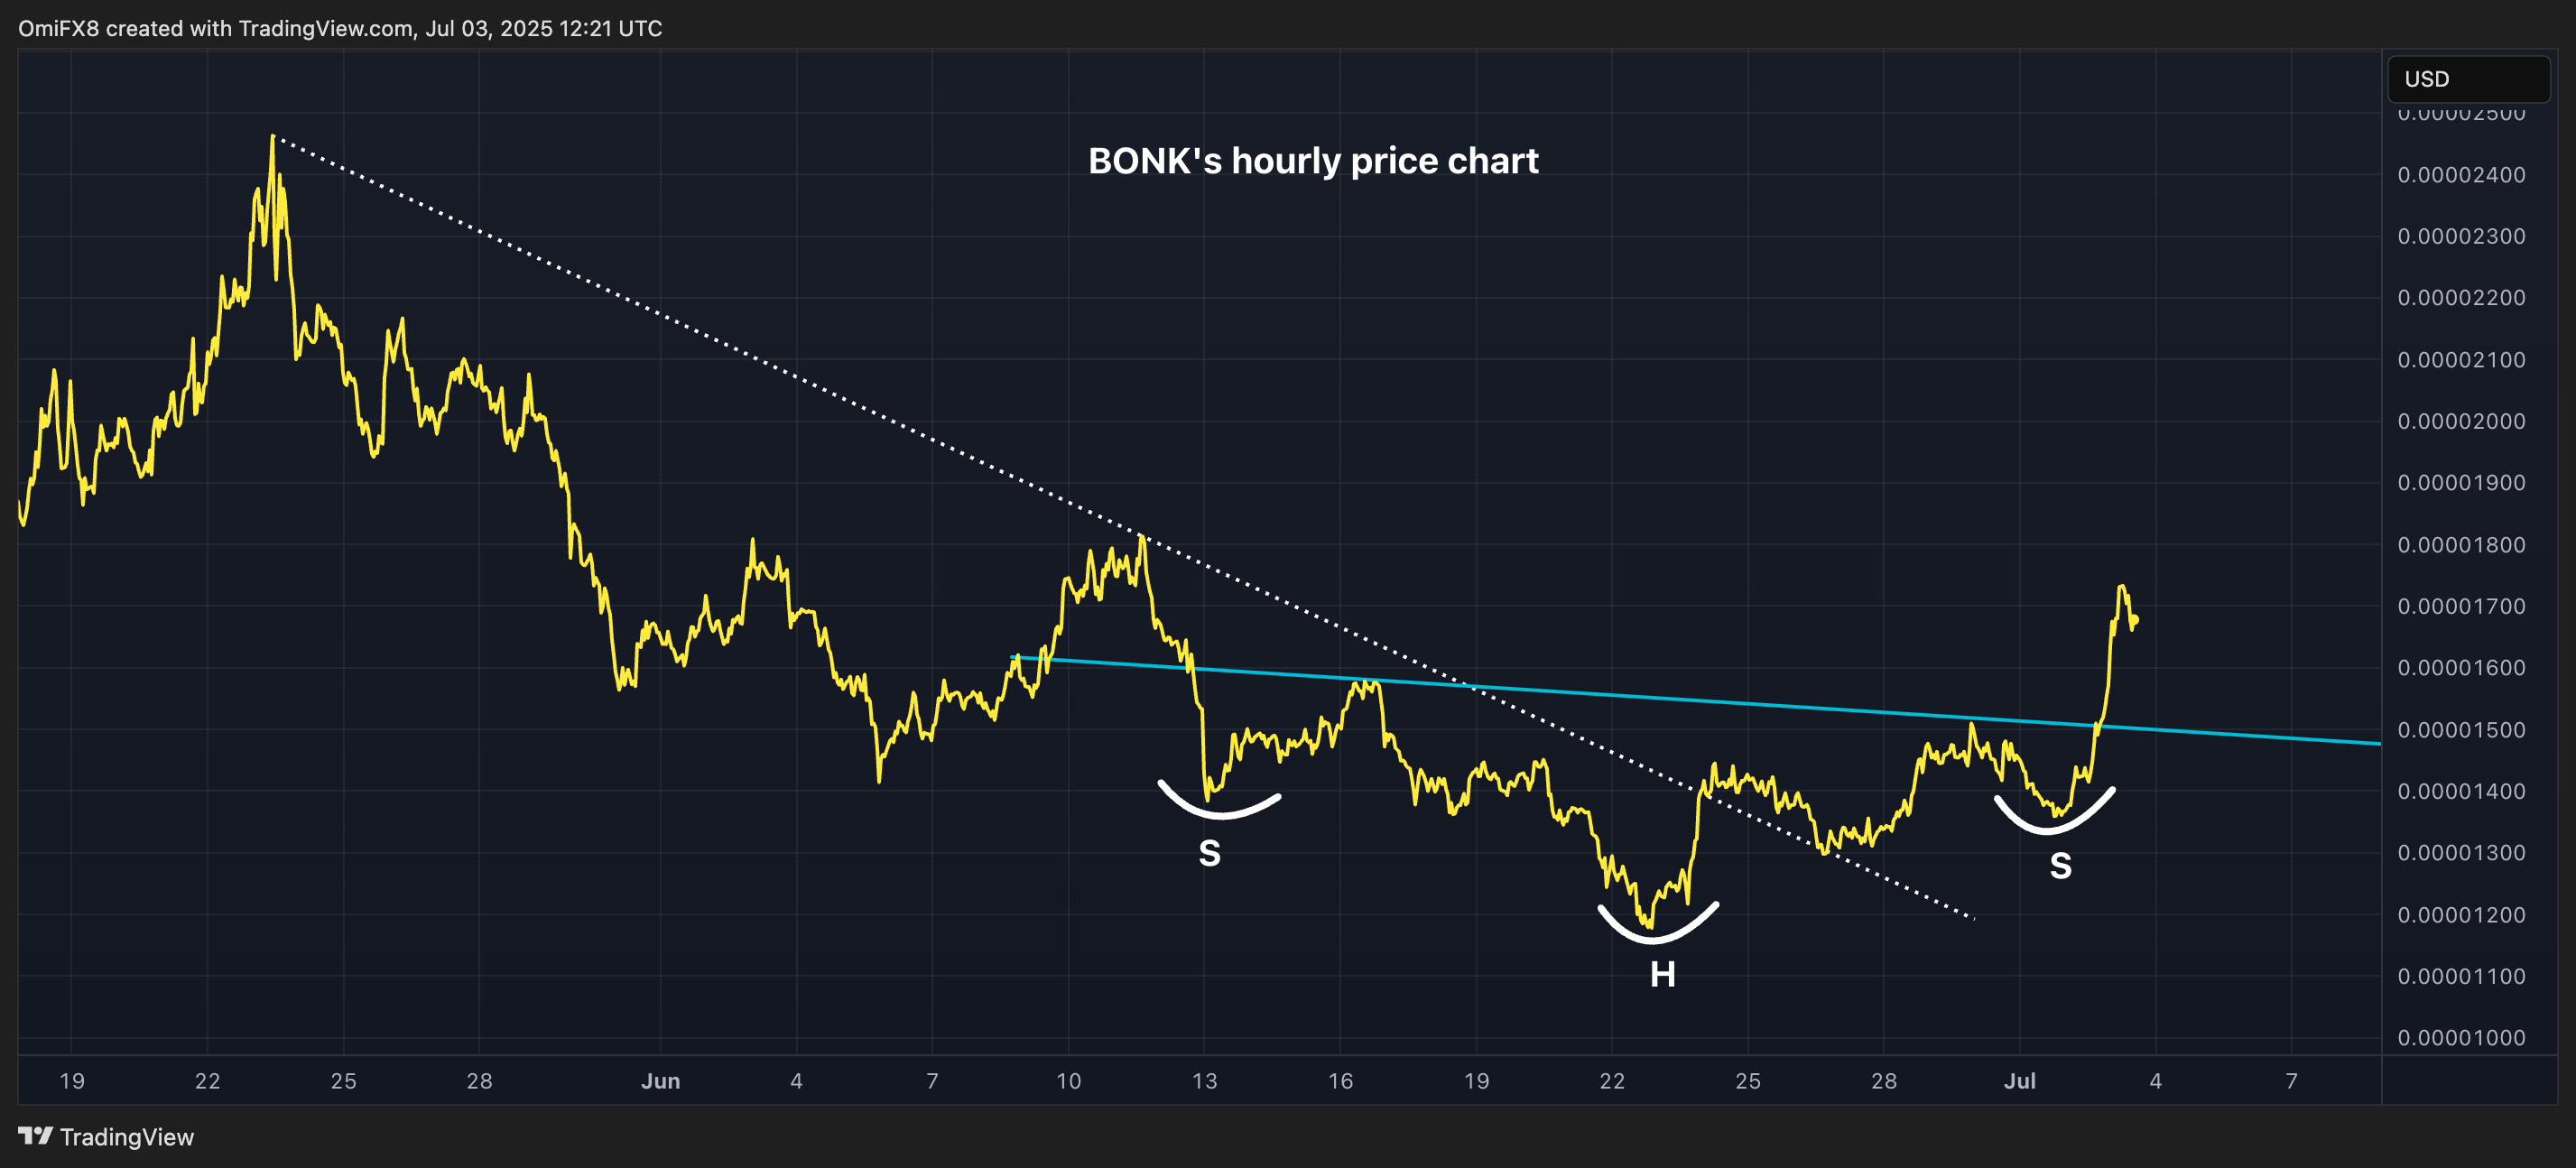
Meme token Shiba Inu (SHIB) has recently completed a major bullish reversal pattern, driven by speculation surrounding Exchange-Traded Funds (ETFs) that has simultaneously propelled BONK to new highs.
In the past 24 hours, SHIB has surged 5.2%, climbing from $0.00001136 to $0.00001195, marked by significant volume spikes that established a new support level at a robust $0.00001162.
This upswing signifies the completion of the inverse head-and-shoulders (H&S) pattern on the hourly chart, indicating a notable shift towards bullish momentum. The inverse H&S, often appearing after a substantial sell-off, consists of three troughs where the middle one represents the lowest point, flanked by two shallower, equidistant troughs.
According to CoinDesk’s AI research, technical indicators suggest that this bullish momentum is likely to persist as SHIB maintains trading above the newly established support levels.

Key AI Insights
- SHIB demonstrated substantial strength between July 2 at 12:00 and July 3 at 11:00, rising from $0.00001136 to $0.00001200, marking a 5.65% gain with a price range of $0.00000081.
- A notable volume spike occurred at 16:00 on July 2, reaching 1.68 billion units, which established a high-volume support level.
- The 24-hour volume profile highlighted strong buying interest, particularly during the European trading session.
- Significant volatility was recorded during the hour from July 3 at 10:09 to 11:08, where SHIB traded initially at $0.00001204 before retracting to $0.00001199.
- A surge in trade volume occurred at 10:18 (15.01B units) followed by a larger spike at 11:04 (20.94B units), correlating with a price recovery after a session low.
- From 05:00 to 10:00 on July 3, sustained trading above $0.0000120 was observed, establishing a new resistance zone.
BONK Surges to New Heights
BONK, the memecoin launched on the Solana blockchain in late 2022, has seen an impressive 23% increase, reaching $0.00001665 within the last 24 hours, making it the best-performing cryptocurrency among the top 100 by market capitalization.
CoinDesk’s AI insights indicate that BONK’s rally was characterized by three distinct waves, with aggressive buying occurring between 23:00 and 01:00 when the trading volume peaked at nearly 3 trillion units, establishing a strong support zone around $0.0000161.
The cryptocurrency is also nearing a milestone of one million holders, following reports that Tuttle Capital’s proposed 2x Long BONK ETF has made significant procedural progress.
From a technical analysis perspective, BONK’s hourly price chart reveals a formation similar to SHIB’s inverse head-and-shoulders bullish reversal pattern.

Key AI Insights
- BONK-USD exhibited notable strength during the period from July 2 at 12:00 to July 3 at 11:00, escalating from $0.0000142 to $0.0000167, corresponding to a 17% increase.
- A significant price range of $0.00000345 (24%) was noted, with strong volume-supported resistance at the $0.0000174 level during the 5:00 hour on July 3.
- During the hour from July 3 at 10:34 to 11:33, BONK-USD demonstrated considerable volatility, dropping 1.35% from $0.00001689 to $0.00001667.
- A substantial sell-off was observed at 10:42 when the price fell 7.6% amid peak volume of 95.9 billion units.