Ostium Labs maintains a bullish outlook on Bitcoin, affirming that its upward trajectory remains intact following the reversal observed in August. In their Market Outlook dated September 1, the firm highlights a crucial threshold at $98,000: “Closing below $98k on this timeframe would turn weekly structure bearish,” they noted, while adding, “above $98k weekly structure is still bullish, and therefore we should anticipate the formation of a higher-low.” This commentary underscores the importance of this price level, suggesting that it serves as a pivot point for future movements.
At the time of the report’s publication, Bitcoin was trading around $108,017. Ostium pointed out that the August monthly candle concluded firmly in red after touching a high of approximately $124.5k before closing near previous resistance-turned-support around $108.2k.
Key Bitcoin Price Levels To Watch Now
According to Ostium, the monthly chart does not exhibit signs of a cyclical top akin to what was observed in 2021. Although the note acknowledged some momentum divergence on the Relative Strength Index (RSI), it emphasized the lack of confirmation from the Awesome Oscillator, concluding, “I do not think this is even remotely similar to the 2021 top formation.” This statement reflects a nuanced understanding of the current market dynamics.
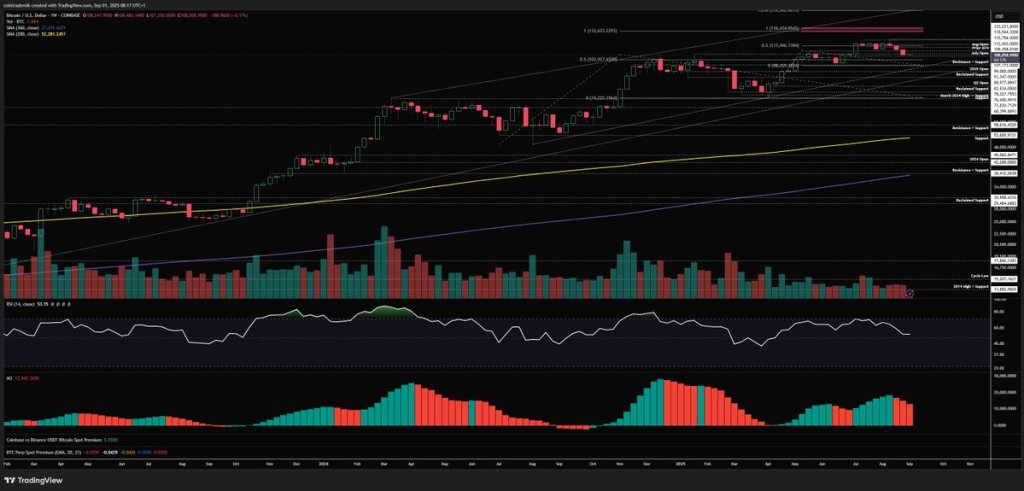
The bearish case strengthens if September closes below $93.3k, which is the 2025 open and lies beneath local trendline support. Conversely, Ostium desires to see September find support above the yearly open, ideally around the July lows at $105k, and to finish the month above the August open at $115k. This configuration would set up the potential for an expansion beyond the recent highs in October.
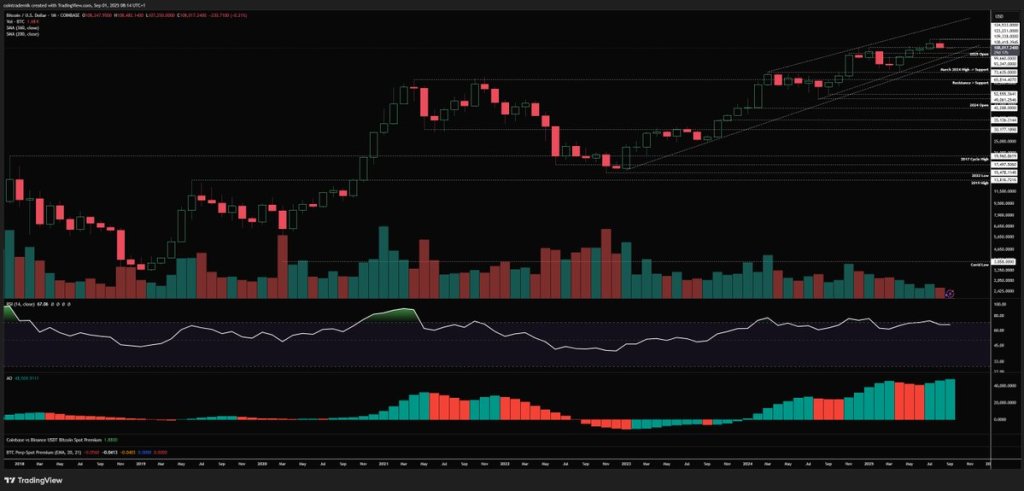
Ostium’s analysis indicates that the weekly structure shows no signs of exhaustion in the upward move, having reset toward 50 on the RSI. They believe this profile supports continuation of the prevailing trend. If the market establishes a higher low in early September and regains momentum, a weekly close above $112k could lead to a retest of the August open and potentially challenge $117.5k ahead of the FOMC meeting, with an aim to revisit the highs before the month concludes.
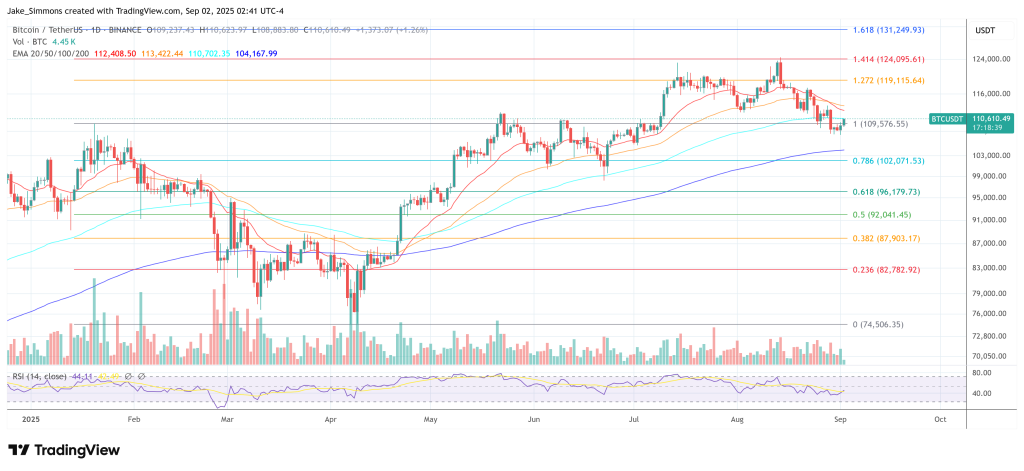
The daily timeframe presents near-term hurdles, with Ostium characterizing the recent pullback as orderly. They cite the $112k prior all-time high, which shifted from support to resistance on the latest downturn, as a crucial level. If Bitcoin breaks and closes above the trendline and above $112k, it would suggest that the bottom is in place. However, a failure to sustain above these levels could bias prices toward the June open at $104.5k, with the 200-day moving average at $101.3k serving as key demand.
As the market anticipates a macro-heavy week, which includes ISM prints, JOLTS data, the Fed’s Beige Book, jobless claims, ADP employment reports, ISM Services, and Nonfarm Payrolls, Ostium outlines tactical setups. For long positions, they recommend waiting for evidence of exhaustion into support, particularly with a trendline resistance respected and bullish divergence forming. Conversely, for short positions, Ostium suggests monitoring for a sharp early-week squeeze into $112k, with trend exhaustion patterns.
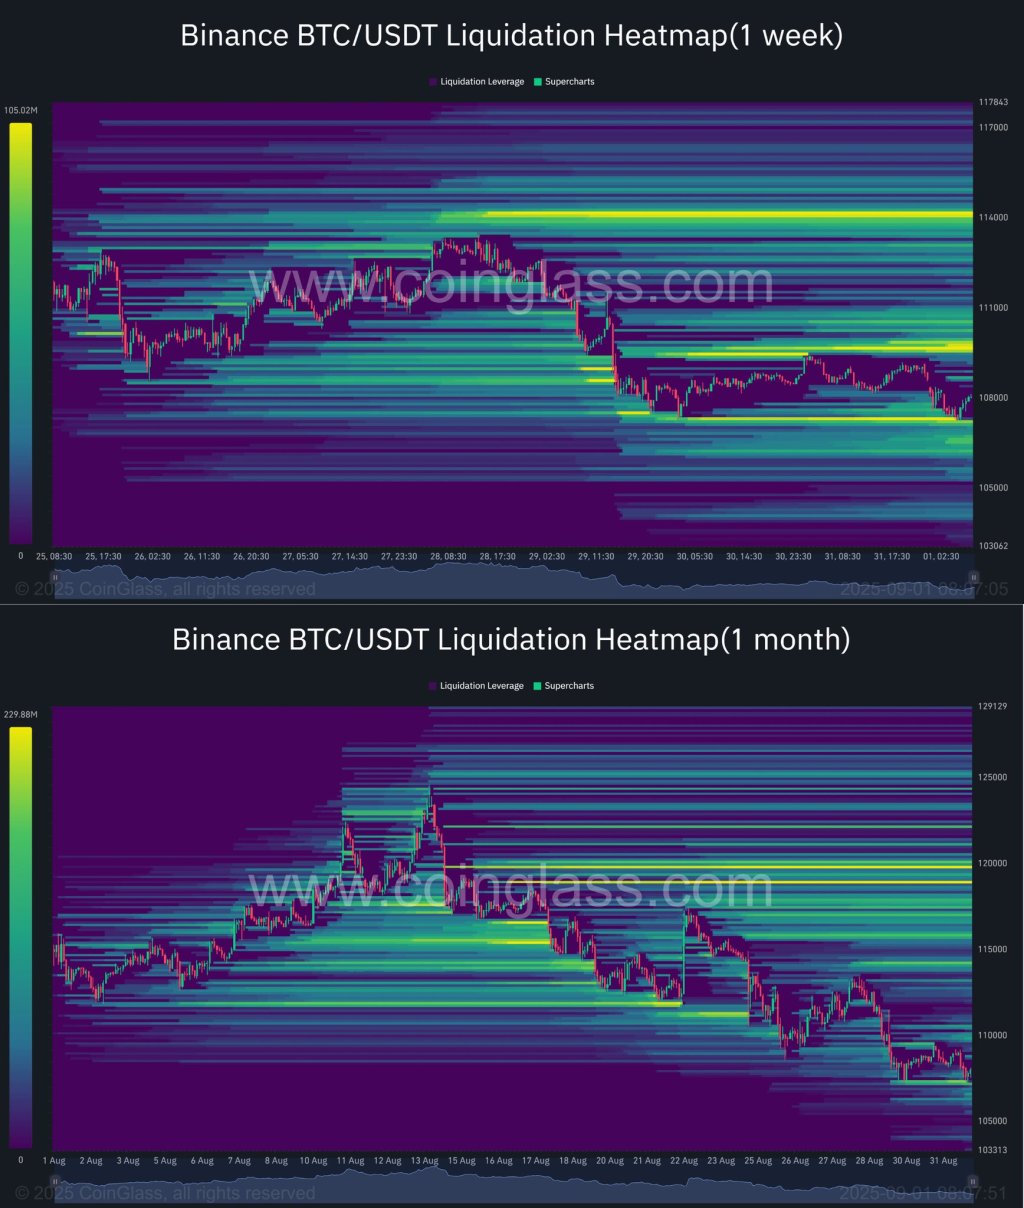
Ostium further reviews market positioning, utilizing insights from Velo and CoinGlass, alongside their analysis of open interest between Bitcoin and altcoins, and detailing the one-week and one-month liquidation maps. Their technical levels align with concentrated liquidation density evident in their heatmaps, particularly around the pivotal $112k and the $105k-$101k demand levels.
DXY As Tailwind For The BTC Price
The report also delves into the broader market context, emphasizing how the dollar backdrop continues to serve as a tailwind for Bitcoin moving toward year-end. With DXY hovering around 97.2, Ostium anticipates a break below 96, potentially pushing toward 94.6. They suggest this scenario could set the stage for a bottoming formation above the 200-month moving average. While not dismissing the secular DXY bull case, Ostium identifies the present phase as a cyclical downswing before a potential recovery driven by policy outcomes.
In summary, Ostium’s September perspective highlights critical thresholds for Bitcoin’s price action. A weekly loss of $98,000 would break the structural trend, and reclaiming $112,000 on a daily basis would indicate that a local low may be in place. Moreover, sustaining above $105,000 monthly and closing back over $115,000 could pave the way for new highs in October.
As of the latest updates, Bitcoin is trading at $110,610.